
 2021-11-24
Analysis of logs in PostgreSQL using EuroDB tools
Traditional log analysis is usually a tedious and tiring process. Can’t it be pleasing and eye-friendly? Today’s topic will be the log analysis module, one of the tools offered in EuroDB, which greatly facilitates the work with logs.
Traditional log analysis is usually a tedious and tiring process. Can’t it be pleasing and eye-friendly? Today’s topic will be the log analysis module, one of the tools offered in EuroDB, which greatly facilitates the work with logs.
The meaning and benefits of analysing database logs
Logs, or chronological records of information about events, have accompanied all fields of computer science from their beginnings to the present day. Their primary task is to inform what really happens during program execution or server operation. The principle of creating logs in the database is the same, and thanks to the analysis of logs, database administrators are able to detect the causes of both known and completely new errors or events. This is one of the reasons why each important database must provide a continuous flow of information about its state and errors, along with the system time. Ideal logs should also contain additional information that, after analysis, can be used by administrators in the optimisation process.
Configuration of basic logs in the Postgres database
Wiedząc o konieczności tworzenia logów w bazie danych, przejdźmy do konfiguracji serwera. Plikiem, który odpowiada za wszelkie konfiguracje w bazie PostgreSQL, jest plik postgresql.conf. Aby go odnaleźć, należy wejść do konsoli bazy danych (psql) i wywołać zapytanie SHOW config_file;. Mając już namierzony plik konfiguracyjny, możemy rozpocząć edycję (przydadzą się tutaj prawa administratora).
Being aware of the need to create logs in the database, we will move to the server configuration. The file that is responsible for all configurations in the PostgreSQL database is the postgresql.conf file. To find it, go to the database console (psql) and run the query SHOW config_file;. Having tracked the configuration file, we can start editing (administrator rights will be useful here).
The configuration file contains a number of commented variables and options that are responsible for creating logs. The most important of them are:
log_directory = 'pg_log'– indicates the directory where the logs are to appearlog_filename = 'postgresql-%Y-%m-%d_%H%M%S.log'– determines the name of the log fileslog_statement = 'all'– specifies the type of queries that are recorded in logs (by default it is set tonone)logging_collector = on– determines whether stderr and csvlog are recorded in logs (by default it is set tooff).
Having introduced the above changes, save the configuration file and restart the PostgreSQL database using, for example, the sudo service postgresql restart command. Now that log creation is properly configured, all events and queries will be recorded in the /var/lib/pgsql_folder/data/pg_log/ directory – the one set in the configuration file in the log_directory variable.
EuroDB Log Analysis Tools
When analysing logs from a large database, you have to take into account tens of thousands of lines, which, in the worst case, will have to be manually checked in search for errors or entries of interest to us. However, many useful tools for filtering the lines or even finding potential errors can be of some help here. The toolkit offered by EuroDB includes one of the best database log analysers. The Loganalyzer module not only creates a detailed analysis of logs, but also enables the generation of charts and graphs. This is extremely convenient for administrators, giving them a more complete picture of the system’s operation. Also the time necessary for analysis and detection of anomalies or errors is definitely shorter. This is especially important in the event of a breakdown. In addition, the module was created to handle even the largest log files, while maintaining its maximum efficiency. We also have the ability to parse gzip compressed files without having to unpack them first.
Basic usage
After installing the log analysis module, we can activate it using the keyword eurodb-loganalyzer. To perform log analysis with default options, just run the following command: eurodb-loganalyzer<LOG PATH>. Upon execution, it will by default create an output out.html file, ready to be displayed in any web browser.
Brighter side of analysis
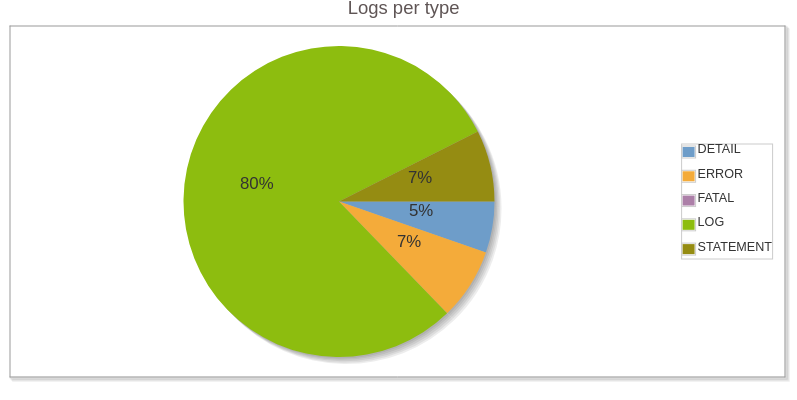
Thanks to the log analysis module, even the most basic database logs can generate an excellent report, giving a good overview of the current state of the database. The sample report contains, among other things, information about errors, their details and the number of occurrences.
In addition, there is also a chart with types of log types. It is especially important in determining the severity of the problem when an error occurs.
More sample charts, not only on database errors, but also on optimisation, can be found on the EuroDB Log Analysis Module product page.
The power of log analysis module
The above-presented way to generate a log analysis report is relatively simplified. To fully use the potential of the module, it is worth using some of the most interesting options:
-b | --begin– specifies the time from which we want to create a report-e | --end– specifies the time by which we want to create a report-o | --outfile– defines the name of the output file-q | --quiet– performs generation without entering anything to the standard output-S | --select-only– makes a compilation only from SELECT queries-T | --title`– changes the title of the HTML report-x | --extension– allows you to choose a different format for the generated file.
Example of a more advanced command to generate log analysis:
> eurodb-loganalyzer -b "2019-05-11 12:25:09" -e "2019-05-11 12:29:09" -o peak.html -q -S -T "Strange Peak 11/5/19" /var/log/postgresql.log
In addition to the analysis capabilities listed above, the Loganalyzer module, which is part of the EuroDB toolkit, has a number of other functions. One of the most interesting is the incremental mode, thanks to which the logs can be compared at any intervals, making the analysis much easier. For detailed information and all tool options, we recommend that you read the manual that opens with the command eurodb-loganalyzer -help.
Summary
The log analysis module allows you to quickly find lots of important information and charts that not only show errors and problems in the database, but also offer unusual, user-friendly statistics. And everything is shown in a simple form, from generating log analysis to presenting charts.