
 2022-02-15
Analysis of statistics in PostgreSQL database using EuroDB tools
Database monitoring is very often underestimated by developers. It is often pushed into the background, even though it is one of the simplest and most effective tools for maintaining and optimizing a database and finding errors in it. Therefore, today we’ll follow up on that topic and take a closer look at analyzing statistics in a PostgreSQL database.
Database monitoring is very often underestimated by developers. It is often pushed into the background, even though it is one of the simplest and most effective tools for maintaining and optimizing a database and finding errors in it.
In our last article on database topics, we touched on monitoring logs in Postgres using the EuroDB log analysis module. Today we’ll follow up on that topic and take a closer look at analyzing statistics in a PostgreSQL database.
Full picture of how the database works
The second, in addition to logs, source of information about the state of the system are the internal statistics of the database. Thanks to such a combination of two reliable sources of information, we have a full picture of the cluster’s functioning, which guarantees peace of mind for both the client and the administrator taking care of the project. Unfortunately, the standard statistics collector implementation built into the PostgreSQL engine is quite cumbersome to use. It’s a common practice to leave only the log information, which is a bad practice. The best and at the same time the simplest solution is to use a tool from the EuroDB package – statistics analysis module. It is designed to create readable reports, which are ready to use by administrators, developers or even business departments. With a view to automation and business support, we implemented the calculation of both average and peak values, as well as activity trends. Statistics analysis module is characterized by very friendly, clear statistics, allowing you to monitor the status of the database in selected time periods, and even the comparative analysis of two selected periods. Undoubtedly, the combination of statistics analysis module with information derived from database logs gives invaluable help in the analysis of all kinds of errors.
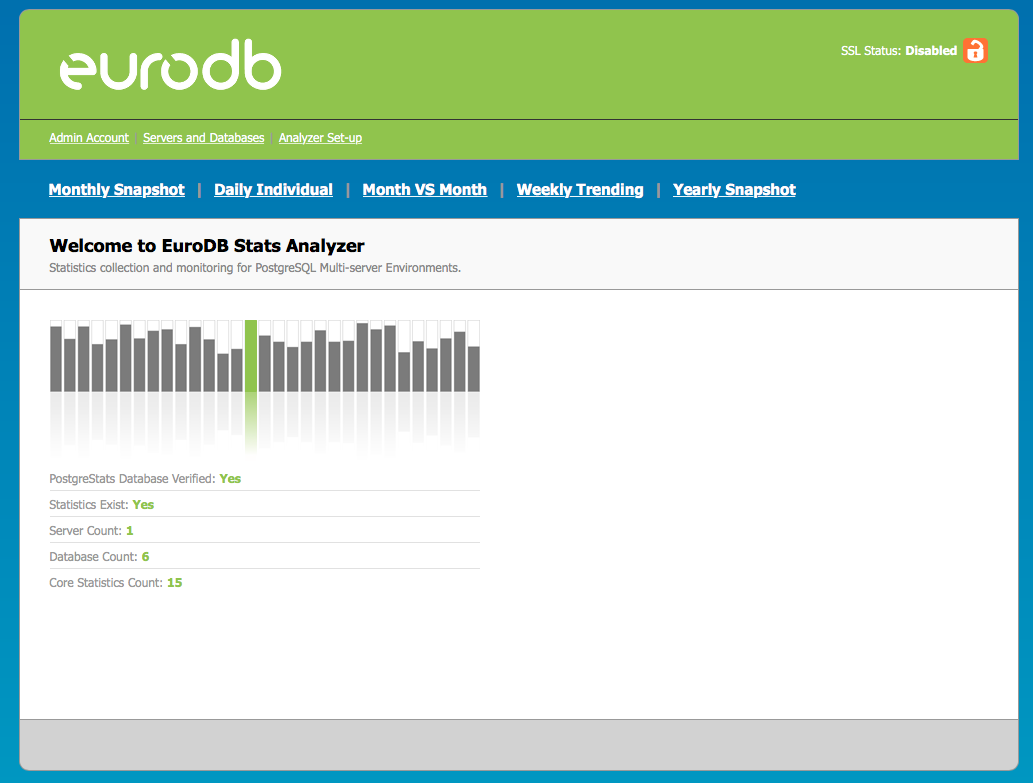
Quick setup of the statistics analysis module
Statistics analysis module is an integral tool of EuroDB package. Its configuration is therefore based on the EuroDB platform, whose engine is PostgreSQL. Instructions on how to configure the module are presented in sections. It is of course also available after installing the package. However, here we have included additional information and ‘half-steps’ for developers who have only basic experience with databases. The configuration starts with installing the module with the installer from EuroDB. Then you need to:
- Start the httpd.service (e.g. with the command:
systemctl start httpd). - Using your browser, go to http://HOST_IP/statsanalyzer/index.php, where HOST_IP is the IP address of the host. This is usually ‘localhost’, so the link we are interested in is http://localhost/statsanalyzer/index.php.
- Generate, according to the instructions given on the page, a script that creates the PostgreStats database, giving a username that will be given access to it. You can give these rights to an existing postgres user or create your own in the database.
- Execute the received script in the system shell as a user with access rights to the database. This user is postgres by default.
- In the file /opt/eurodb/statsanalyzer/scripts/ps_conf.php, change the username and password to the user you specified when generating the script.
- In case we forgot the password, or we don’t know it, we can run a database query to reassign the password for the user. We will run the database shell using the
psqlscript, and the query will look likeALTER USER postgres PASSWORD 'password';. - Reload the /statsanalyzer/index.php page and provide a temporary administrator name along with the password. This information will be available in the default ‘Set-up’ tab in step 3.
- In the ‘Servers and Databases’ tab, add the server and database you are interested in. For example, for a local server this would be: Name:
localHost:localhostPort:5432. The database is added in a similar manner, specifying the actual database name and the user from which the connection is being made. - It is recommended that a
SELECT pg_stat_reset();query be performed on a properly configured database to create an up-to-date picture of its operation. - Add a new entry to the Cron that updates the information in the statistics analysis module (e.g. with the command:
crontab -e, adding:55 23 * * * /usr/bin/php /opt/eurodb/statsanalyzer/scripts/ps_cron.php). Manual execution of theps_cron.phpscript also performs the update.
A new approach to analysis
Even after the first day of using the module, you can see that there is a lot of data displayed. However, only when you use the Cron tool to systematically update the statistics analysis module, you can see the true enormity of information. A very thoughtful side of the module is also the graphic design, which is clear.
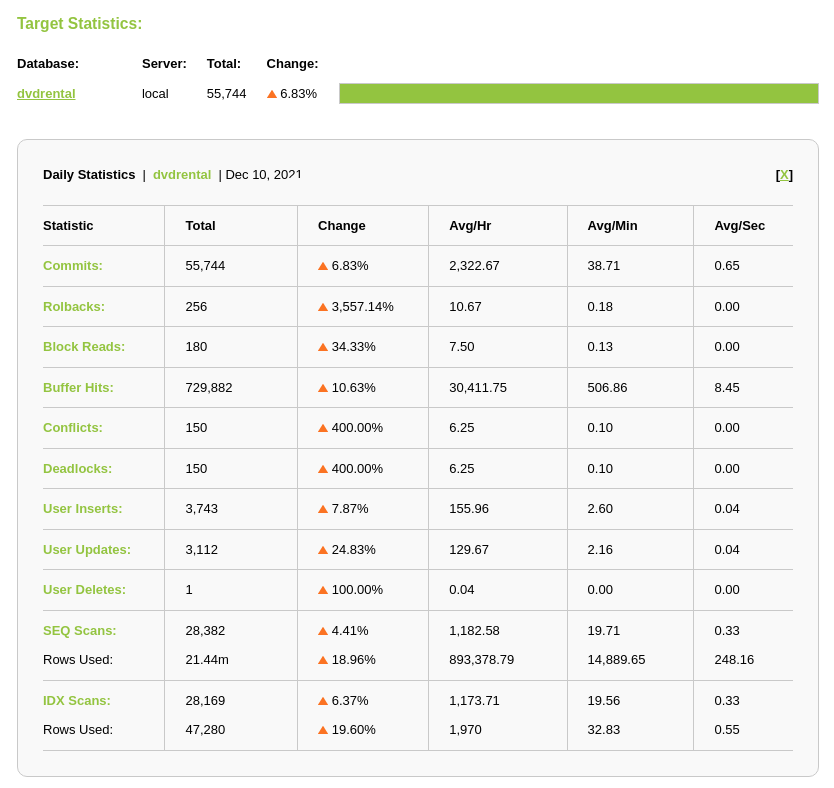
For an example summary of the day, the statistics include:
- approvals (commits)
- rollbacks
- block reads
- cache hits
- conflicts
- deadlocks
- user inserts
- update users
- delete users
- sequential scans
- indexed scans.
However, for each of these groups, the report includes:
- quantity
- change from the same day to the previous day
- hourly average
- average minutes
- average seconds.
Cost optimization-friendly technology
Using the statistics analysis module, we are able to spot a potential threat, find an error or increase database optimization faster. Consider the following problem:
After implementing a new version of the application, the database administrator observed a significant increase in sequential scans.
An example solution using the statistics analysis module:
By putting analogous periods together, it was possible to determine that the change in the number of scans appears only after the implementation date. By correlating this data with the information obtained by log analysis, a suboptimal query was discovered. Correcting it resulted in a reduction of maintenance costs for the entire system.
Summary
As you can see, the statistics analysis module is a useful tool that clearly shows how the database works. In conjunction with the log analysis module, it provides a whole picture of how our cluster is functioning. More application examples along with information about the module itself can be found in the Statistics Analysis tab.